Operating Systems –
Week 6 Lecture 1
I/O Management and Device Types
Despite the multitude of
input/output (I/O) devices that constantly appear (and disappear) in the
marketplace and the swift rate of change in device technology, the Device
Manager must manage every peripheral device of the system. To do so, it must
maintain a delicate balance of supply and demand - balancing the system’s
finite supply of devices with users’ almost-infinite demand for them.
This
week looks at the Device Manager’s four basic functions:
·
Monitoring the status of each device
·
Enforcing preset policies
·
Allocating each device appropriately
·
Deallocating each device at two levels
Although
many users may think of an I/O request as an elementary machine action, the
Device Manager actually divides the task into three parts, with each one
handled by a specific software component of the device management
subsystem.
1)
The I/O traffic controller monitors the status of every device, control unit,
and channel. This is a job that becomes more complex as the number of units in
the I/O subsystem increases and as the number of paths between these units
increases. Discuss the tasks that must be performed for each I/O request.
2)
The I/O scheduler performs a job analogous to the one performed by the Process
Scheduler described in Chapter 4 on processor management – that is, it
allocates the devices, control units, and channels. Note that some systems
allow the I/O scheduler to give preferential treatment to I/O requests from
high-priority programs.
3)
The I/O device handler processes I/O interrupts, handles error conditions, and
provides detailed scheduling algorithms, which are extremely device dependent.
Sequential Access Storage Media
The
first secondary storage medium used for electronic digital computers was paper
in the form of printouts, punch cards, and paper tape. Magnetic tape followed
for routine secondary storage in early computer systems.
The
figure below is a zoomed in top view of magnetic tape.

Nine-track
magnetic tape with three characters recorded using odd parity. A 1/2-inch wide
reel of tape, typically used to back up a mainframe computer, can store
thousands of characters, or bytes, per inch. Parity bits are used for error
correction in case on of the other data bits is
corrupted.
The
term “Tape Density” refers to the number of characters recorded per inch.
Sequential
nagentic tape contains an “Interrecord
gap (IRG)” which may be a ½ inch gap inserted between each record. The IRG is
the same size regardless of sizes of records it separates
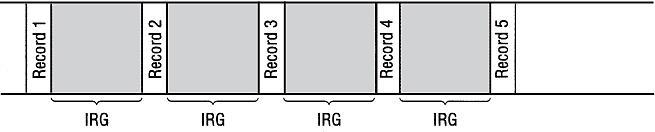
IRGs
in magnetic tape. Each record requires only 1/10 inch of tape. When 10 records
are stored individually on magnetic tape, they are separated by IRGs, which
adds up to 4.5 inches of tape. This totals 5.5 inches of tape. Are we
wasting tape here?
We
can also divide data (records) into blocks. Ultimately we are looking to
maximize Transfer rate which equals: (tape density) x (transport speed). Using
an “Interblock gap (IBG)” and a ½ inch gap inserted
between each block, we have can achieve a better transfer rate than individual
records and IRG. The optimal block size is achieved if
the entire block fits in the buffer.
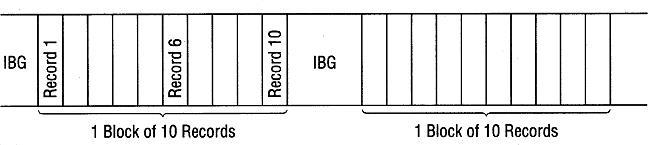
·
Two blocks of records stored on magnetic tape, each preceded
by an IBG of 1/2 inch. Each block holds 10 records, each of which is still 1/10
inch. The block, however, is 1 inch, for a total of 1.5 inches. Our Tape
Density is greater and thus we achieve a greater transfer rate.
·
Blocking does have some disadvantages:
·
Overhead and software routines needed for blocking,
de-blocking, and record keeping
·
Buffer space wasted when only one logical record needed
·
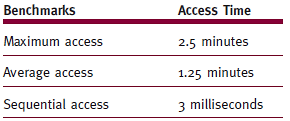
Note the main disadvantage to sequential media in general is
that requested data can be anywhere on the tape and the every ounce of data
before the requested data must be analyzed before we even get to our records.
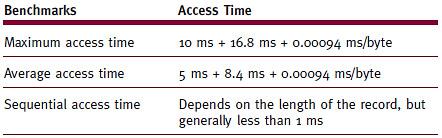
The table below shows just how slow it can be to find a file on magnetic tape
in worse case scenarios:
|
|
Access
times for 2400-foot magnetic tape with a tape transport speed of 200 inches
per second. |
·
Note that magnetic tape is not obsolete. In fact
magnetic tape is the primary backup solution for most Data Centers in
production today. A typical solution may be a robotic library with 1000
tapes within. There may be 20 or so tape drives connected to the library
as well. Thousands of servers can connect to such a library over a SAN (Storage
Area Network) to perform nightly backups to tape. Tape operators
physically remove and reload the library daily so multiple copies of backups
are stored (typically both on site and off site in case of a disaster).
Direct Access Storage Devices
Direct
access storage devices (DASDs) include all devices that can directly read or
write to an arbitrary place in storage. Note that DASDs can be grouped into
three categories: magnetic disks, optical discs, and solid state (flash)
memory.
Magnetic Disk Storage
Magnetic
disk drives, such as computer hard drives (and the floppy disk drives of
yesteryear), usually feature one or more read/write heads that float over each
surface of each disk. Disk drives can have a single platter, or a
stack of magnetic platters, called a disk pack.
·
A disk pack is a stack of magnetic platters. The read/write
heads move between each pair of surfaces, and all of the heads are moved in
unison by the arm. This is the side view of a typical hard disk drive.
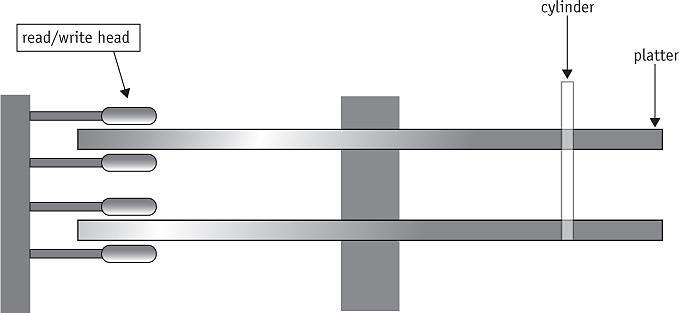
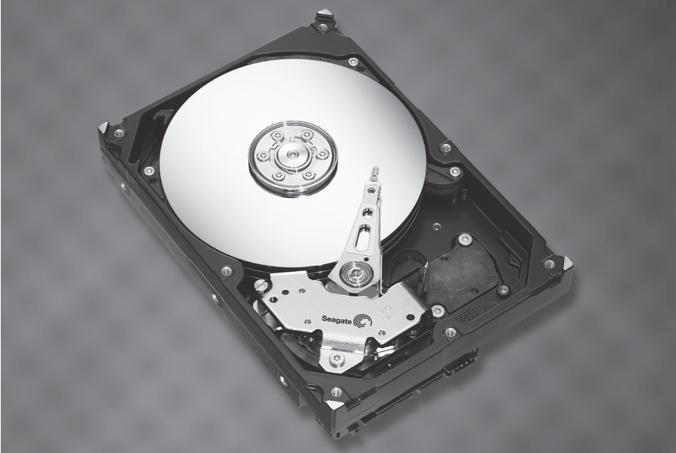
The
top view of an actual disk drive is shown below. On a typical hard disk, the
arm moves two read/write heads between each pair of surfaces: one for the
surface above it and one for the surface below, as well as one for the
uppermost surface and another for the lowermost surface.
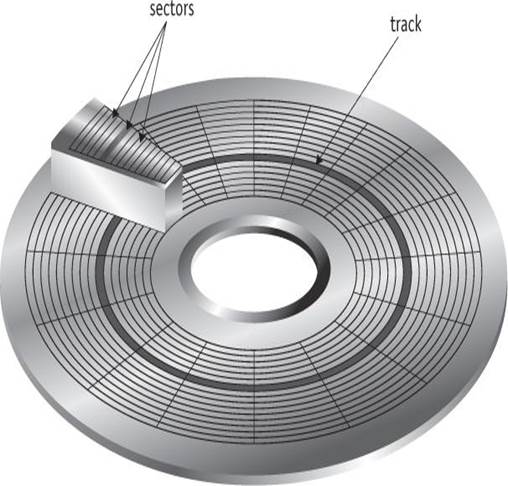
To
access any given record, the system needs three things: its cylinder number, so
the arm can move the read/write heads to it; its surface number, so the proper
read/write head is activated; and its sector number.
See the diagram below for how a disk platter is divided
into tracks and sectors.
·
The total time required to access a file on a hard disk is
determined by three factors:
o
Seek time (slowest) – This is the time required to position
the read/write head over the correct track.
o
Search time – This is rotational delay – i.e. The time it
takes to rotate the DASD until the desired record is under the read / write
head
o
Transfer time (fastest) – The time to actually transfer the
data from the platter through the read / write head and to main memory.
Total
Access Time = Seek Time + Search Time +
Transfer Time
·
There is another kind of magnetic drive called the “Fixed
Head” magnetic drive. This type of disk drive contains
a read / write head that does not move – it remains in a fixed position over
the entire platter. Because there is no time
involved in positioning the read / write head, the Seek time is eliminated,
making the total transfer time = search time + transfer time.
·
The diagrams below demonstrate how a fixed head drive looks
and performs:
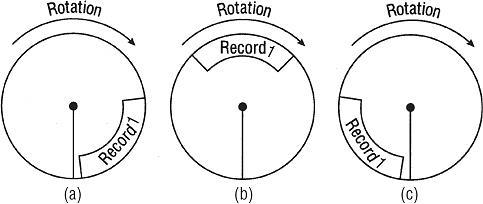
·
As a disk rotates, Record 1 may be near the read/write head
and ready to be scanned, as seen in (a); in the farthest position just past the
head, (c); or somewhere in between, as in the average case, (b).
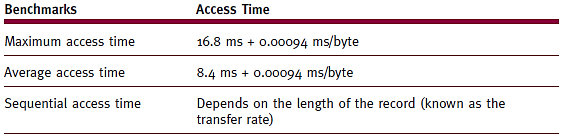
·
Access times for a fixed-head disk drive at 16.8 ms/revolution.
·
Typical times for a movable head head
drive such as a typical hard drive.
Device
Handler Seek Strategies
A
seek strategy for the I/O device handler is the predetermined policy that the
device handler uses to allocate access to the device among the many processes
that may be waiting for it. It determines the order in which the processes get
the device; the goal is to keep seek time to a minimum. There
are multiple sscheduling algorithms for optimizing
seek time and their main objectives are to minimize
arm movement, minimize average response time, and minimize variance in response
time.
First-come,
first-served (FCFS) – read / write arm moves from track to track to fulfill
requests in the order received. On average this does not meet the
three seek strategy goals as the algorithm typically results in extreme arm
movement.
·
Shortest seek time first (SSTF) – processes rrequests with track closest to one being served even if
the request is not next in line. This strategy
minimizes overall seek time by postponing traveling to out of way tracks and
thus reducing total arm movement.
·
Other algorithms include “SCAN” which contains multiple
variations (LOOK, N-Step SCAN, C-SCAN, and C-LOOK).
·
The idea behind Scan Algorithms is to move the arm
methodically. The arm basically always moves as far as
it can inward, processing everything along the way. When it
reaches the inner most track, it turns around and reverses direction, again
processing everything along it way back outward.
Optical
Disc Storage
Advancements
in laser technology made possible the advent of CD, DVD, and Blu-ray optical
disc storage. Note however, that there are many differences between an optical
disc and a magnetic disk, including the design of the tracks and sectors.
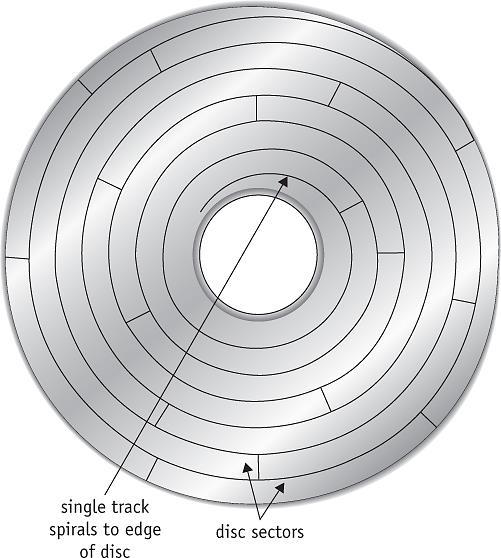
·
Optical Disk Design features
o
Single spiralling track
o
Same-sized sectors: from center to disc rim
o
Spins at constant linear velocity (CLV)
o
More sectors and more disc data than magnetic disk
·
On an optical disc, the sectors (not all sectors are shown
here) are of the same size throughout the disc. The disc drive changes speed to
compensate, but it spins at a constant linear velocity (CLV). A magnetic disk
spins at a constant Angular velocity (CAV) which means it is always spinning at
the same speed.
Some
of the most important measures of optical disc drive performance are sustained
data transfer rate and average access time.
Search
Strategies: Rotational Ordering
Rotational
ordering is used to optimize search times. Requests are rearranged once
read/write heads positioned. This prevents the need to come back to the
same track later on if other requests are on the same track or a nearby
track. This reduces time wasted due to rotational delay. Note
that only one read/write head can be active at any one time, so the controller
must be ready to handle mutually exclusive requests.
CD and DVD Technology
·
The figure below demonstrates what the data looks like on
the surface of the three mediums listed below.
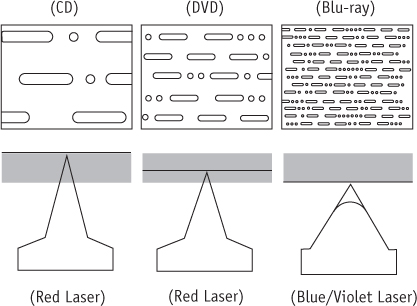
·
Notice how much more data is packed on a track on a Blu-ray
vs a CD. Blu-ray and DVD technology also allow for more than one surface – i.e.
the laser can read and right to and from multiple layers within the same
“film.”
To
put data on an optical disc, a high-intensity laser beam burns indentations on
the disc that are called pits. These pits contrast with the unburned flat
areas, called lands. Note that optical discs can have one to multiple layers,
allowing the laser to look through upper layers to read those below.
Rewritable
discs (classified as CD-RW and DVD-RW) use a process called phase change
technology to write, erase, and rewrite data. The disc’s recording layer uses
an alloy of silver, indium, antimony, and tellurium. The recording layer has
two different phase states: amorphous and crystalline. In the amorphous state,
light is not reflected as well as in the crystalline state.
Although
DVDs use the same design and are the same size and shape as CDs, they can store
much more data.
Components of the I/O Subsystem
Regardless
of the hardware makeup of the system, every piece of the I/O subsystem must
work harmoniously.
·
I/O subsystem: a
collection of modules within the operating system that controls all I/O
requests. The diagram below is an overview of the entire I/O
Subsystem.
·
I/O channel: a
specialized programmable unit placed between the CPU and the control units,
which synchronizes the fast speed of the CPU with the slow speed of the I/O
device and vice versa, making it possible to overlap I/O operations with CPU
operations.
·
I/O control unit: the
hardware unit containing the electronic components common to one type of I/O
device, such as a disk drive.
·
Disk controller: (disk
drive interface) Links disk drive and system bus
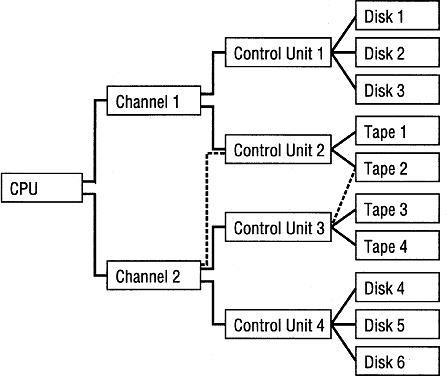
The
example I/O subsystem above is typical of an enterprise
server. Its configuration contains multiple paths, which
increase both flexibility and reliability. With two additional paths, shown
with dashed lines, if Control Unit 2 malfunctions, then Tape 2 can still be
accessed via Control Unit 3.